Anantam International SPC Fund - 6 SP
- Druckenmiller has spoken extensively about how momentum can drive prices well beyond what fundamentals justify - and why this is precisely when caution matters most. His own experience during the tech bubble illustrates the point starkly. Fundamentally convinced the bubble would burst, he initially went short in early 1999. But as the market kept climbing and outside traders he'd hired were making ~3% a day, FOMO won. In what he himself called "an emotional fit," he bought $6 billion in tech stocks near the very top in March 2000 - and lost $3 billion in six weeks. We've been sitting with this story for the past two months. The lesson: you can never be too careful.
- The semiconductor index rallied ~39% in April and another ~22% in May - moves we missed entirely. We sat out May consciously, uncomfortable with the near hockey-stick trajectory. In hindsight, we should have read the Hormuz closure as the
- catalyst: markets now treat chips and memory as the new oil, and the flight to strategic scarcity flowed into semiconductors, not crude. That rotation was knowable within our framework, and we're incorporating the lesson. June has brought a pullback - whether a top or a pause before another leg up remains unclear - and we maintain our cautious stance.
- Emerging markets tell a similar story - the rally has been driven by a narrow set of AI-linked plays, with limited breadth across the broader market. Narrow leadership is rarely a sign of health.
- Macro risks are building. Hormuz remains closed, oil inventories are declining, and inflation looks increasingly persistent. Early signs of liquidity stress are also emerging - a pipeline of large IPOs could absorb significant capital, with knock-on effects across asset prices.
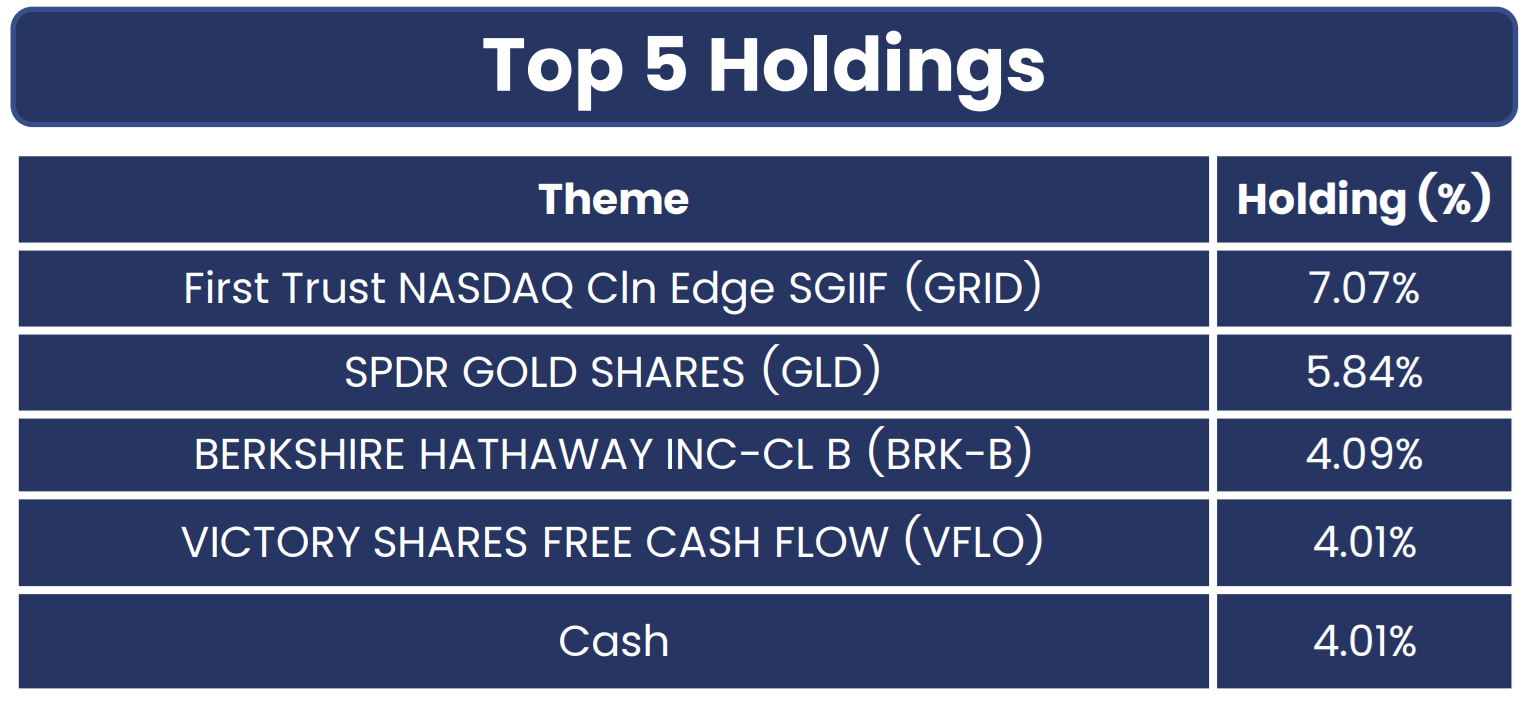
- Drones, free cash flow, and green energy drove performance. Hedges were a drag. China, despite supportive tailwinds, has not moved.
Investment Objective
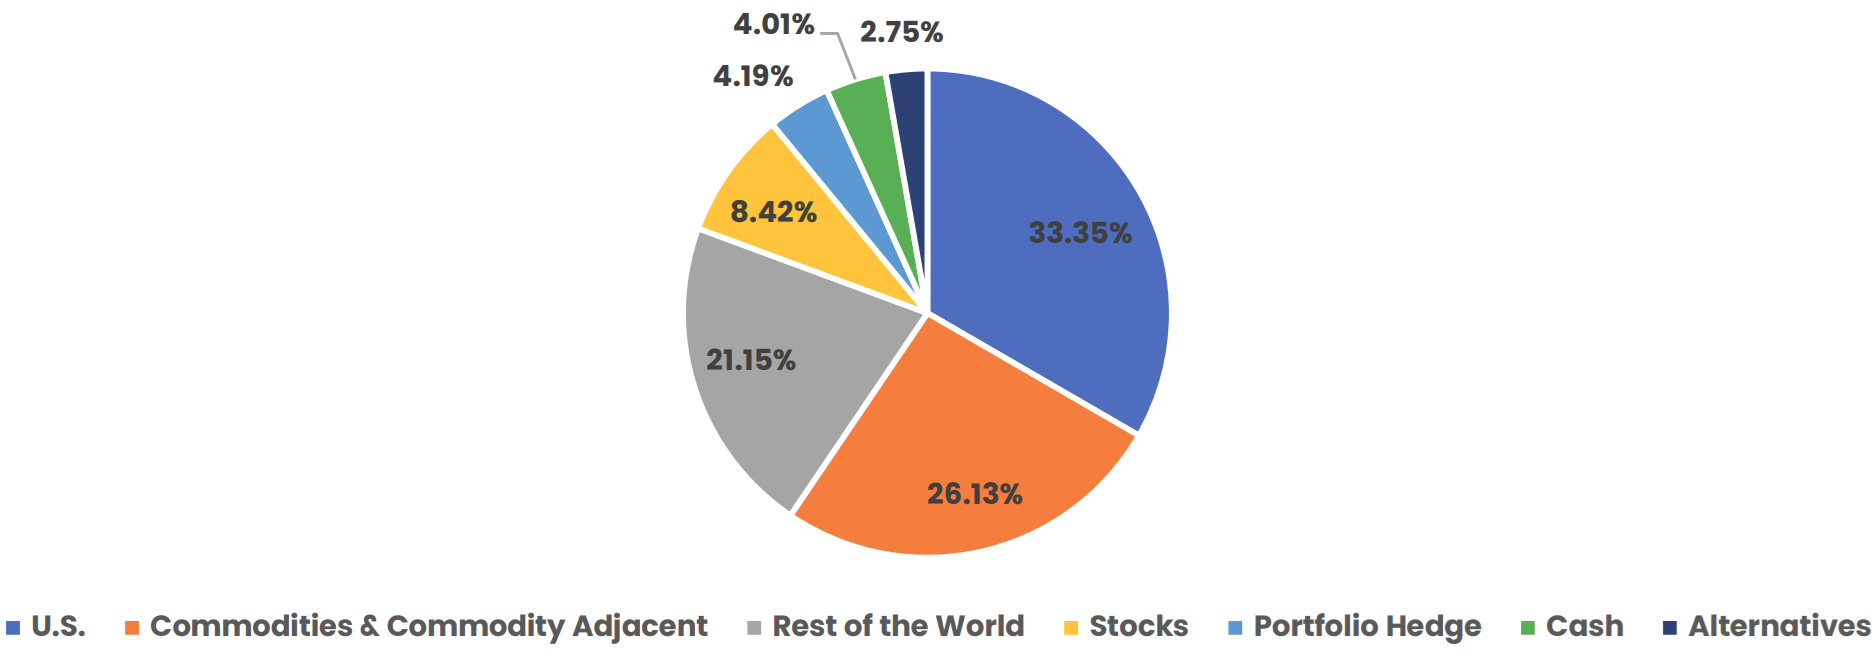
To generate income and capital appreciation by investing primarily in listed securities of developed and select emerging markets. The strategy is implemented mainly through US-listed exchange-traded funds (ETFs) and listed equity securities. Exposure to listed debt or debt-linked instruments, including exchange-traded notes (ETNs), may be taken opportunistically. The fund does not invest in unlisted securities.
| Particulars | Remarks |
|---|---|
| Currency | USD |
| Type | Open ended |
| Minimum Investment | $100,000 |
| Minimum top up post 1st investment | $25,000 |
| Subscription | Weekly, NAV is declared on every Friday and on the last working day of every month |
| Redemption | Anytime, subject to at least 15 calendar days of notice |
| Partial Redemptions | Permitted, subject to post redemption minimum investment at $100,000 |
| Redemption Fee/ Exit Load | 1% for exit within 12 months from investing |
| Management Fee | 1% per annum; charged monthly on average AUM |
| Performance Fee | 15% performance fee over hurdle of 7% (subject to high watermark) |
| Operating Fee | On Actuals, capped at 0.5%p.a. on AUM |
| Hurdle Rate | 7% |
| Fund Name | Anantam International SPC Fund – 6 SP (Cayman Island) |
| Investment Manager | Dovetail Investment Management Limited |
| Fund's Bank Account | SBM Bank (Mauritius) Limited |
| Auditor | Forvis Mazars |
| Administrator | Ohm Dovetail Global Admin (IFSC) Private Limited |
Benchmarks
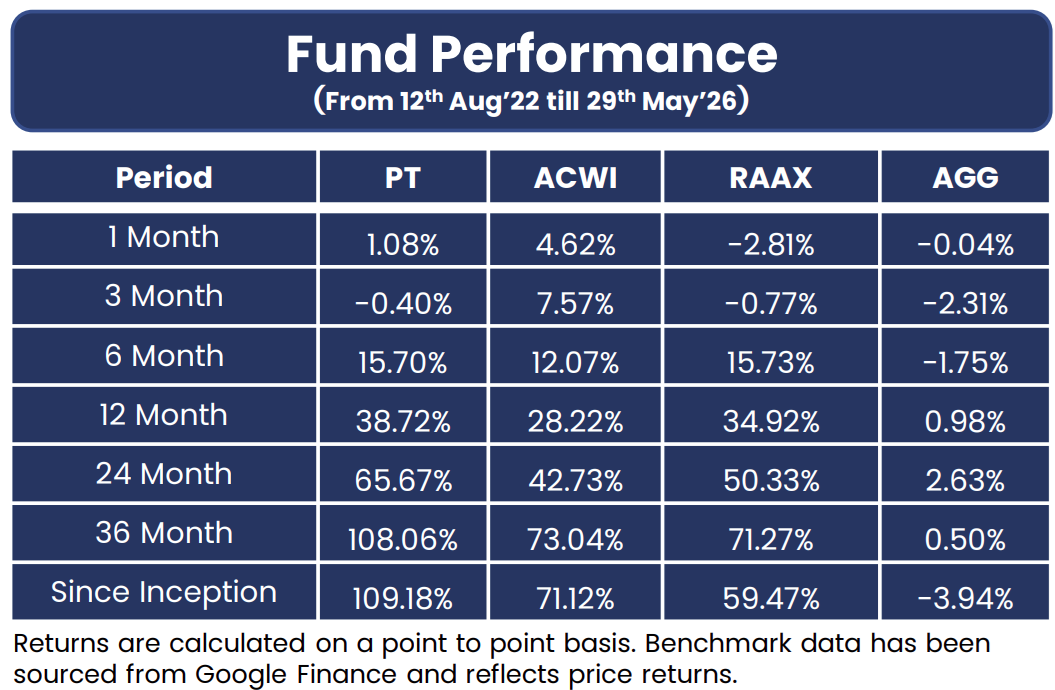
Equity Benchmark – iShares MSCI ACWI ETF (ACWI): Tracks the MSCI All Country World Index, covering large and mid-cap stocks across 23 developed and 24 emerging markets, representing approximately 85% of global equity market capitalization with U.S. exposure of 64.28%. Serves as a comprehensive reference for global equity performance.
Bond Benchmark – iShares Core U.S. Aggregate Bond ETF (AGG): Tracks the Bloomberg U.S. Aggregate Bond Index, representing the U.S. investment-grade bond market including Treasuries, mortgage-backed securities, and corporate bonds. Serves as the standard reference for U.S. fixed income performance.
Real Assets Benchmark – VanEck Real Assets ETF (RAAX): Provides diversified exposure to commodities, natural resource equities, REITs, infrastructure, and gold. Selected to capture the role of real assets as an inflation hedge and as a diversifier against equity and bond risks.
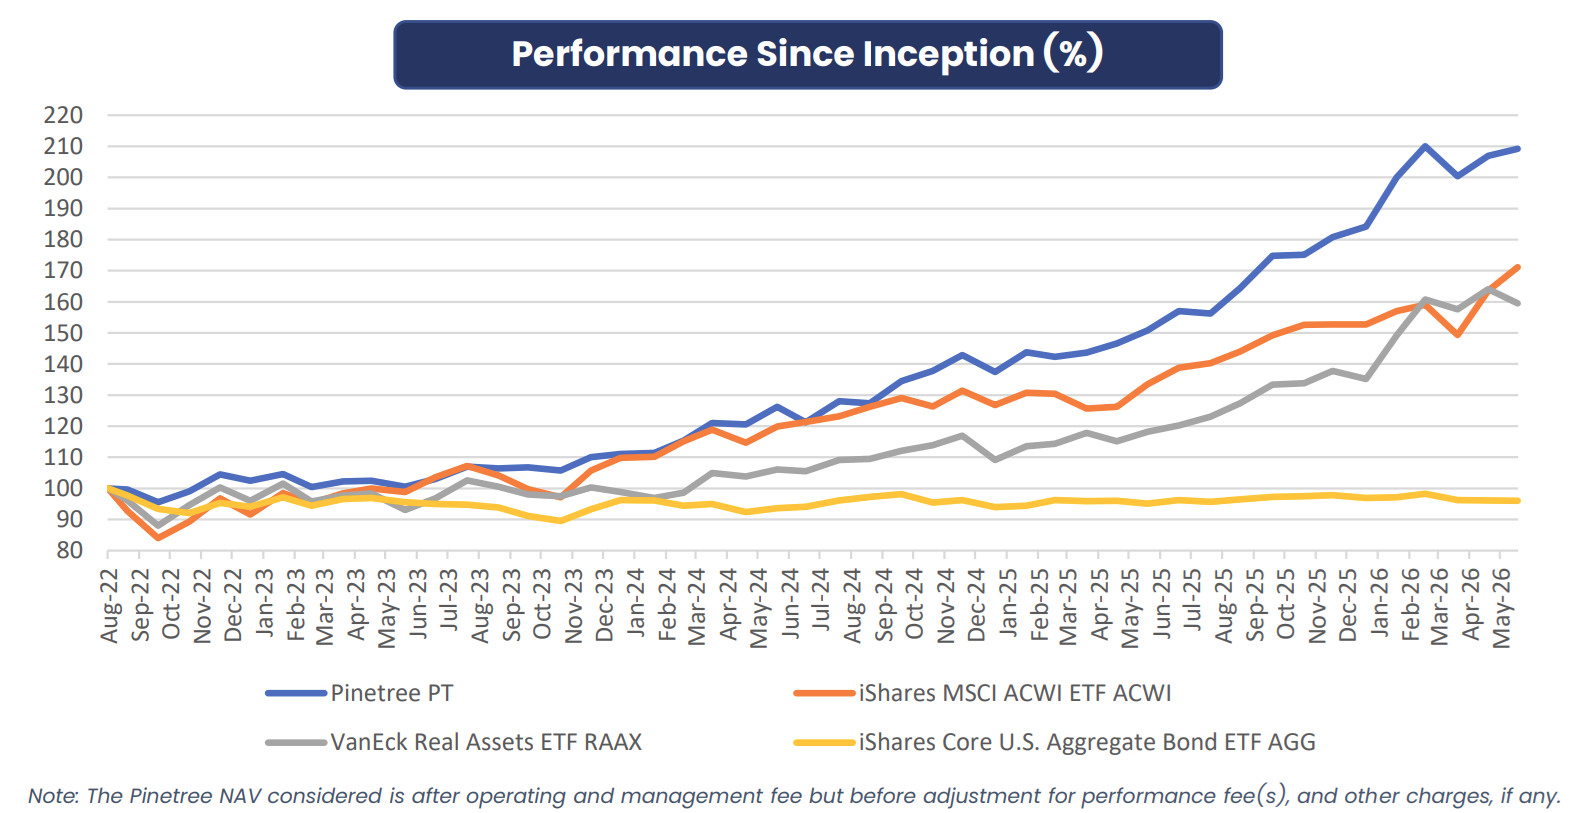
Peers in the space typically use a 60:40 blend of the MSCI World Stock Index and Bloomberg Global Bond Index as a benchmark. However, we have chosen to present three distinct benchmarks, each at 100% weight, to more clearly reflect PineTree’s investment style and asset allocation.
The inclusion of a real assets benchmark reflects our macro view: as early signs of a multipolar currency world emerge, global supply chain efficiency will be tested, driving procurement costs higher. At the same time, developed economies face mounting debt. In this environment, real asset owners such as commodity producers and efficient commodity procurers are well positioned to benefit. Incorporating real assets into the benchmark increases the challenge for our fund, as hard commodities also serve as an important hedge against inflation.
Together, ACWI, AGG, and RAAX provide a transparent framework to evaluate PineTree’s performance across global equities, U.S. fixed income, and real assets. Each benchmark was selected for its accuracy in representing the targeted asset class and relevance to the current macroeconomic environment.